MAD dataset on initiation factor 5A
Only 1 of 3 selenium atoms in 147 residues used in phasing (just for this test example)
Solvent content was 60%
Resolution of 2 A, space group I4
Initial correlation of experimental map with one based on refined model was 0.37
Correlation after RESOLVE was 0.79
Correlation after conventional solvent flattening and histogram matching (using dm) was 0.65
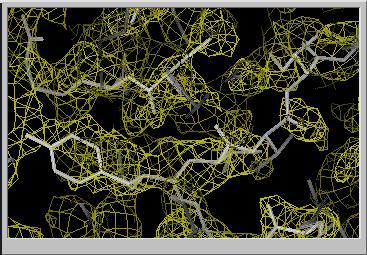
Initial MAD map (CC=0.37)
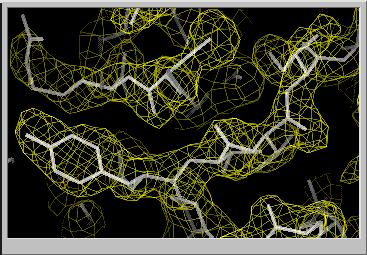
RESOLVE map (CC=0.79)
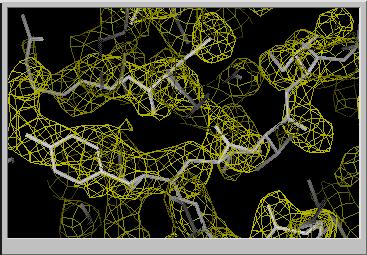
Conventional solvent flattening & histogram matching (CC=0.65)